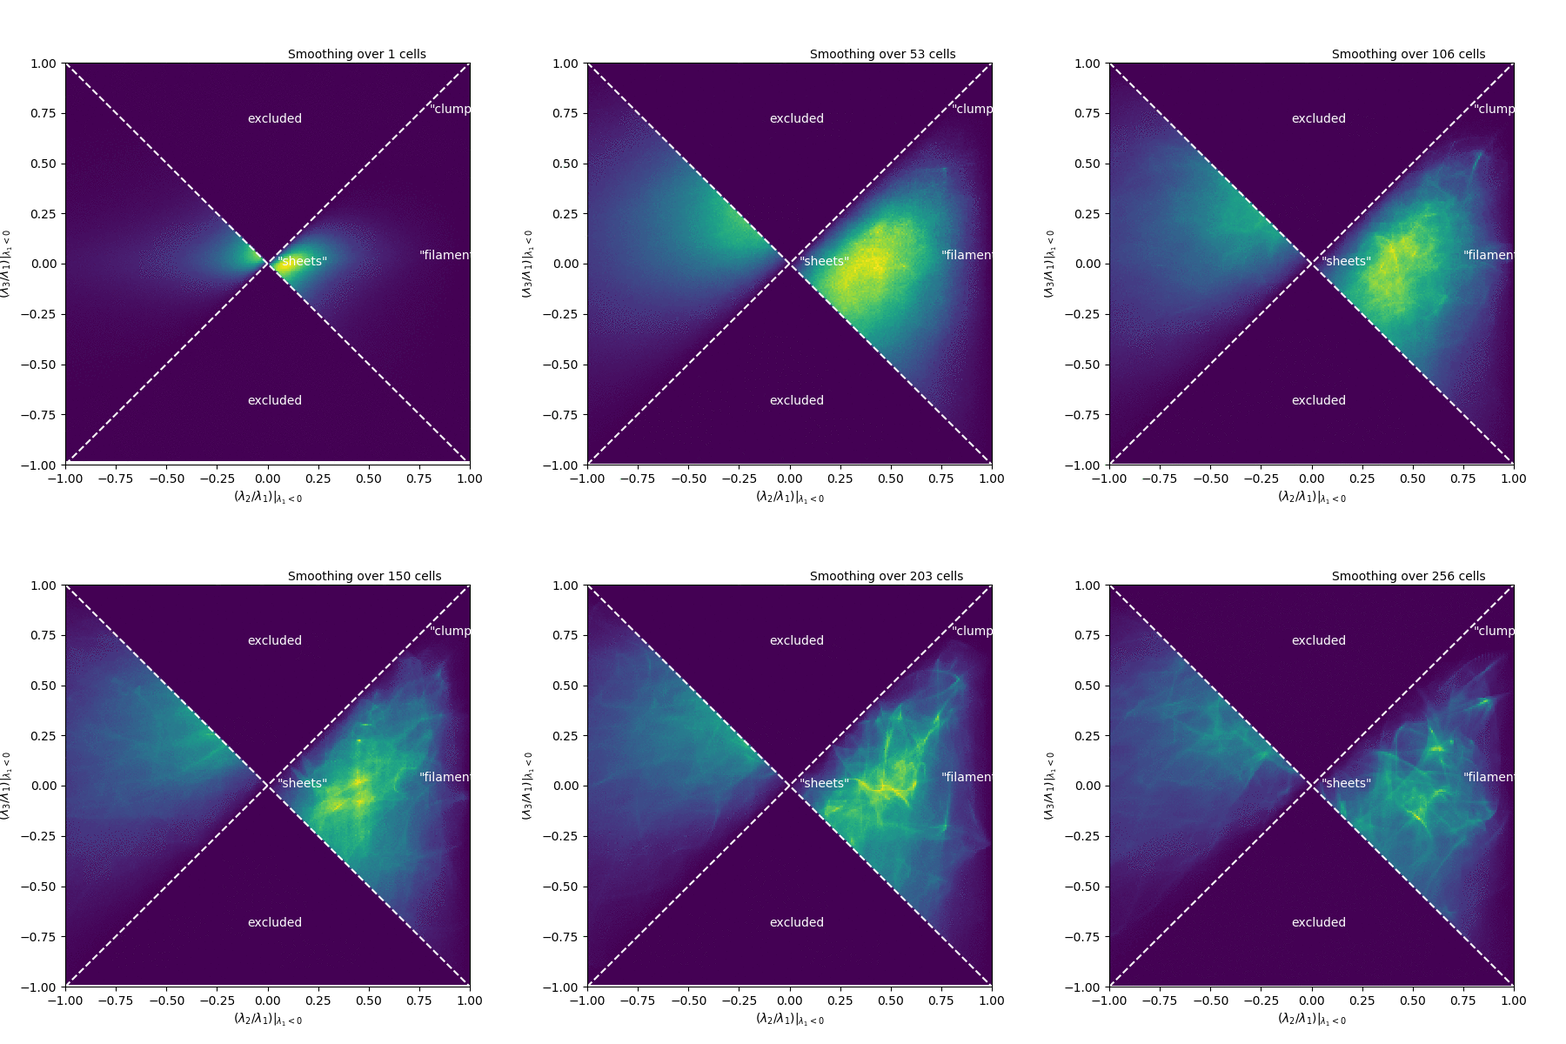
The sites of star formation are self-gravitating, supersonic, magnetized turbulent clouds. These clouds are riddled with small-scale structure - clumps, filaments, and shocks - which undoubtedly play a role in how stars form. To understand these structures a bit better, my collaborator Nia Imara (Harvard) and I have been thinking about statistics we might use to characterize them!
Inspired by the Zel’dovich approximation, used to describe structure formation in cosmology as a succession of gravitational collapse into sheets, filaments, and halos or clusters, we’ve been exploring the following space. At each point in a turbulent box simulation, we compute the Hessian matrix, composed of all the second spatial derivatives of the density. This matrix describes the curvature of the density. We then compute the eigenvalues of this matrix, which each correspond to the size of the curvature in one of the three spatial dimensions, though in coordinates that are not necessarily aligned with x, y, and z.
In this space of eigenvalues, “clumps” should be found where all three eigenvalues are large and negative, while “filaments” only need two eigenvalues to be large and negative (the third should be small), and “sheets” should have one large, and two small eigenvalues. This space of eigenvalues is shown in the animation, where each frame corresponds to a different smoothing scale for the density. In this particular simulation, there is remarkably little mass that clearly resides in any of these categories. Instead, it occupies a range of values right in the middle! There is also a good deal of mass where the second eigenvalue has a sizable positive value, corresponding to thin structures where the density oscillates up and down along the structure. It remains to be seen how this distribution will be affected by changing the inputs of the simulation, but it could be that the nomenclature and interpretation around these small-scale structures could use some revision.