 As a new Flatiron Research Fellow who stared a few weeks ago, most of my time here so far has been taken up with getting myself set up in a new institute, and a new country. But, I’ve also had time to continue some of my thesis work from a few years ago now, which involves using the Made-to-Measure (M2M; Syer & Tremaine 1996) technique to tailor galaxy simulations to match data. Or in this case, fake data.
With M2M, you start with some particle model of the desired galaxy, and then slowly alter the weights of the model particles in order to better represent the target system, while also letting the particles orbit in the galactic potential. While the traditional M2M algorithm runs on a ‘test particle’ system, where the gravitational potential is fixed and known, my algorithm PRIMAL runs on a live N-body model, where the gravity is calculated from the interaction of the particles themselves. So, because we change the particle masses, the potential also changes, and can theoretically be recovered. During my PhD I showed that PRIMAL can recover a simple galaxy model, from mock data constructed with a selection function based on the European Space Agency’s Gaia mission (Hunt & Kawata 2014), with the goal of applying PRIMAL to actual data from Gaia to create a new model of the Milky Way.
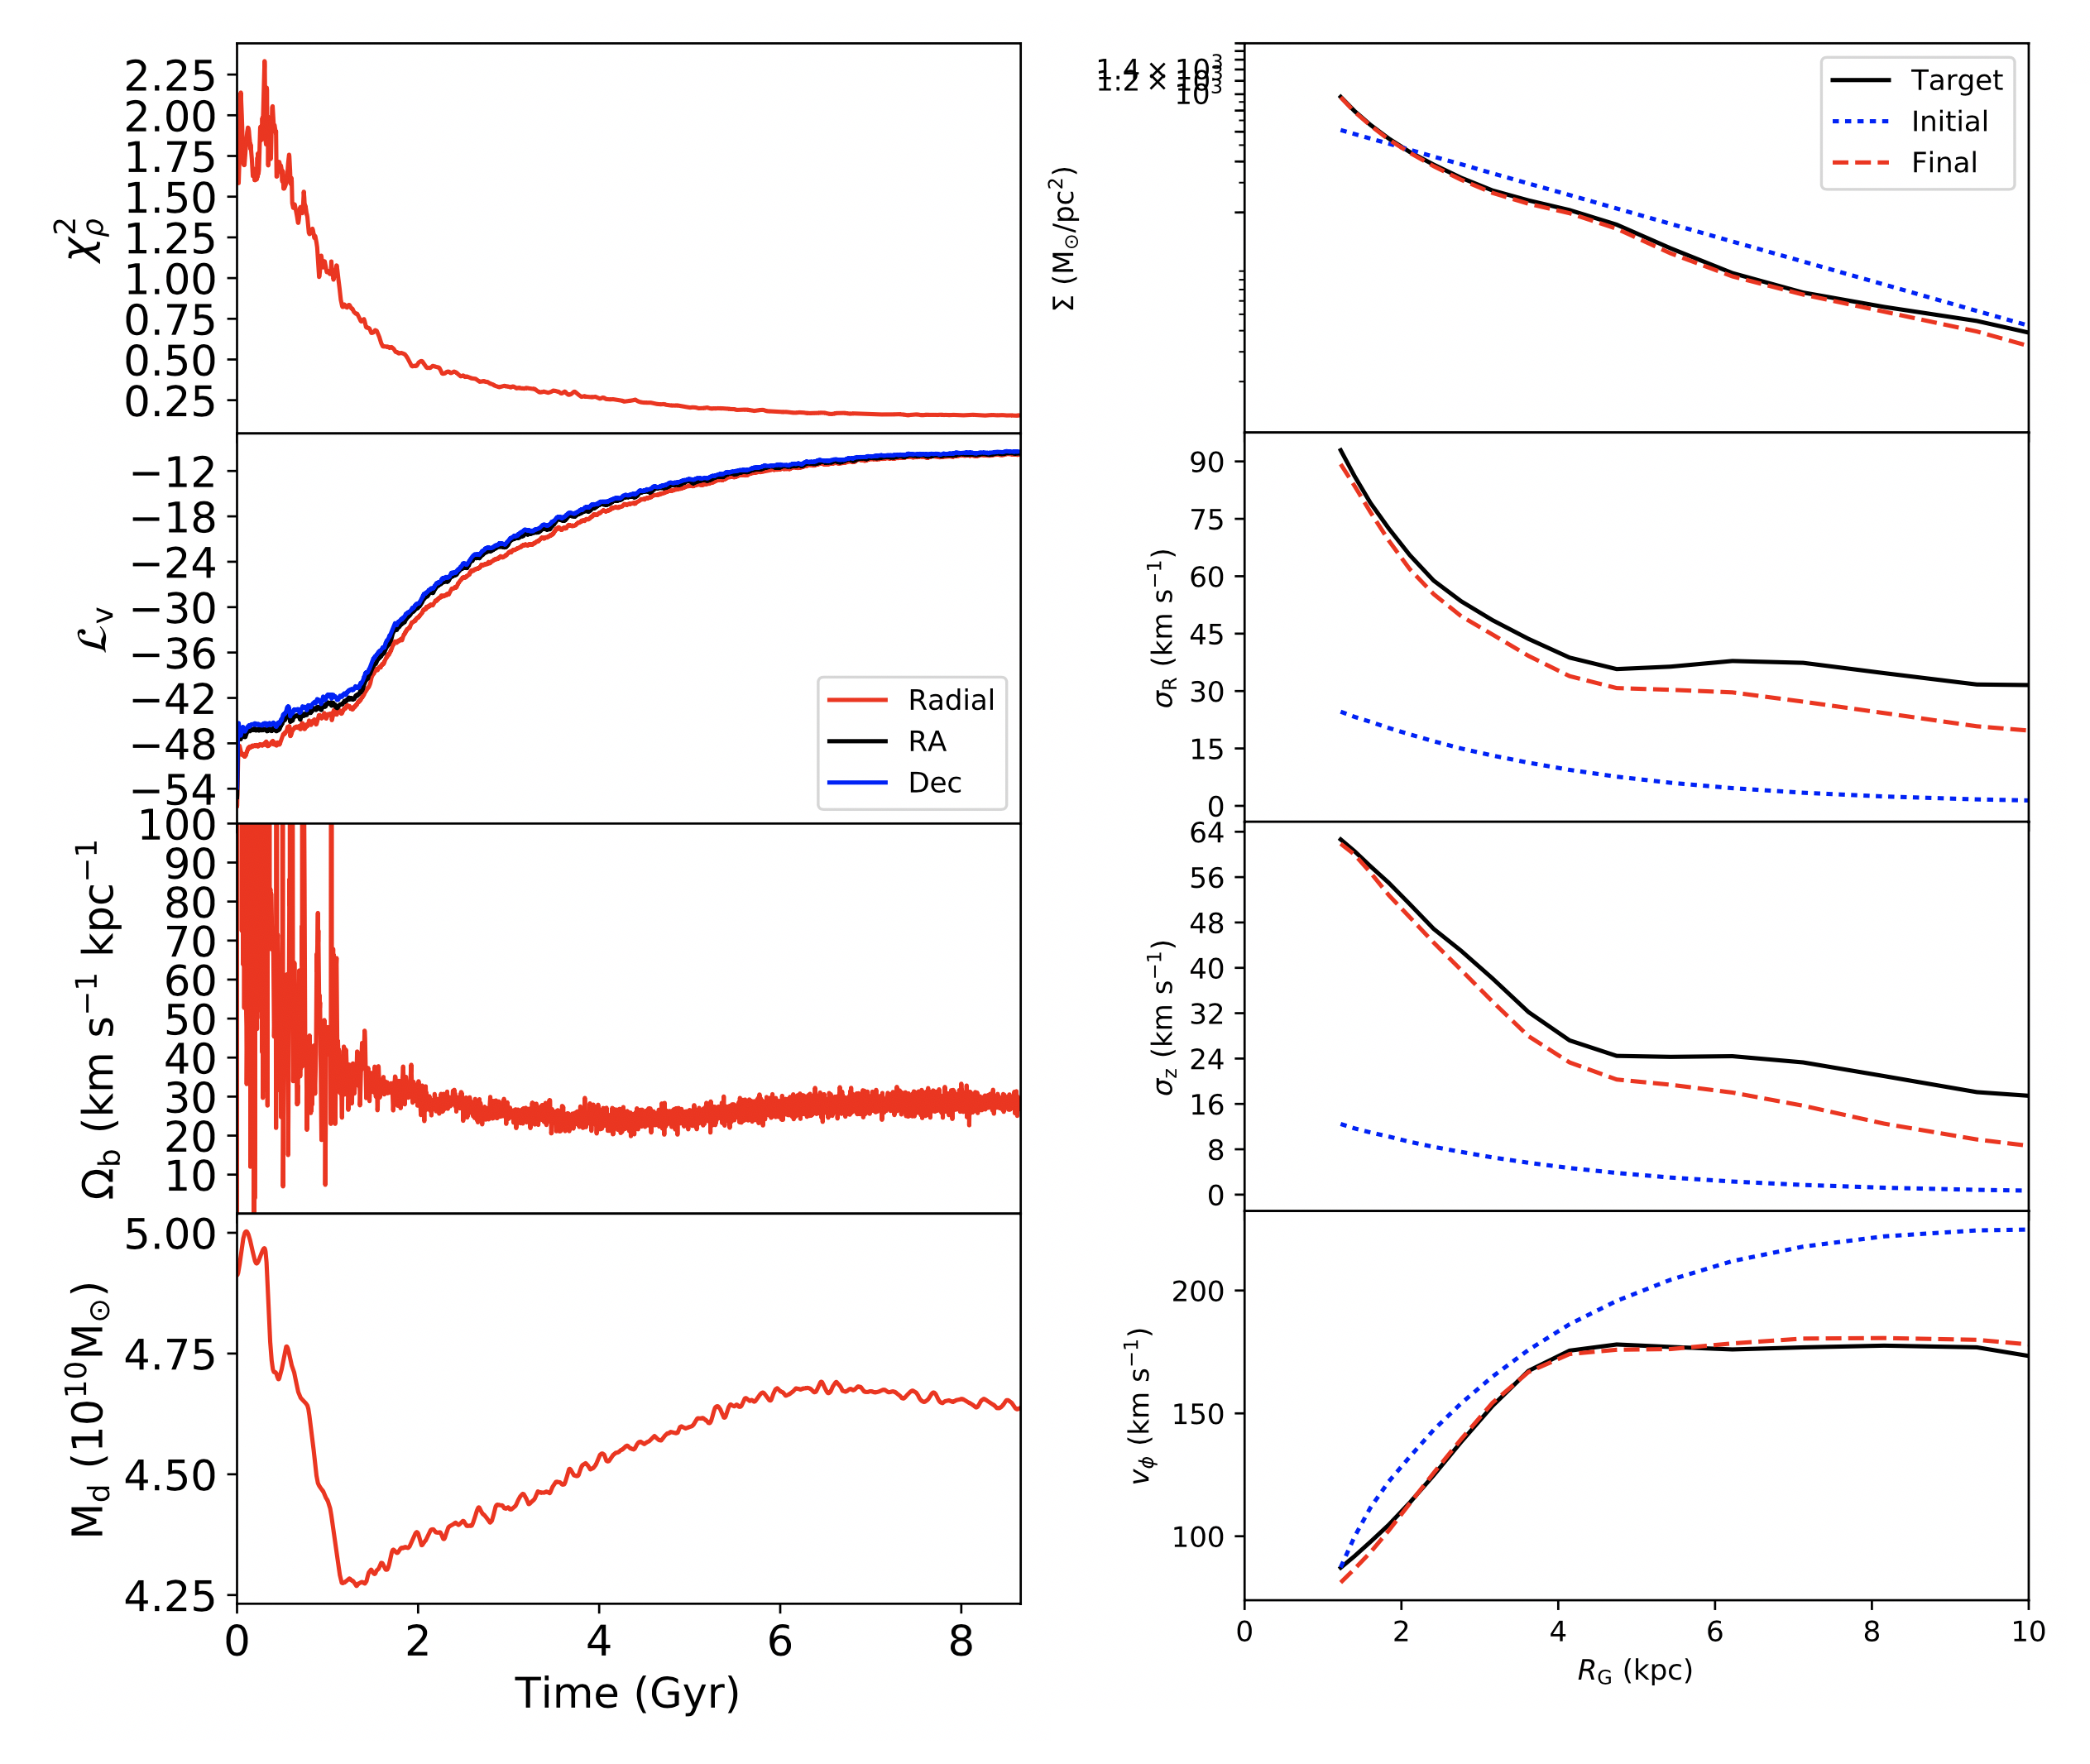
However, this previous galaxy model was relatively smooth, with only the galactic bar for non-axisymmetric structure. In reality the Milky Way has significant disequilibria features in both the positions and motions of the stars, some of which are likely owing to the interaction with satellite galaxies. So far it remains an open question how well PRIMAL (or M2M in general) can recover such features. As an initial test of this I am applying PRIMAL to a galaxy from the Auriga cosmological simulation, which formed through a series of mergers and is a more realistic target. The modeling is ongoing, and in the Figures here you can see the progress part way through the simulation. The left plot shows the time evolution of the density fit (upper panel), the kinematic fit in all three dimensions (2nd panel), the bar rotation speed (third panel) and the disc mass (lower panel). The right hand panel shows the radial profiles of the surface density (upper panel), the radial velocity dispersion (2nd panel), the vertical velocity dispersion (third panel) and the mean rotation velocity (lower panel), for the initial model (blue dotted line), the target data (black line) and the current state of the model (red dashed line). The model is now a considerably better fit to the target data than the initial model, but it is still converging and I won’t know how well we’ve done for another week or so.