We’ve been working with David W. Hogg on “How to find gaps” (or under-densities) in a data-set. Our current method relies on having a twice-differentiable density estimator (see the previous post), namely a KDE using a quartic kernel, and some KDTree tricks for rapidity (it works! So fast!).
We can find the “critical points” (minima, maxima, saddle points) using the Hessian (second derivative) of the estimated densities (i.e. on a grid). And from each of these critical points, we can also trace the “paths” going down the density gradient. Now, we need to figure out what metric(s) will best characterize the “gappiness” of a point(critical or on a path) for selection.
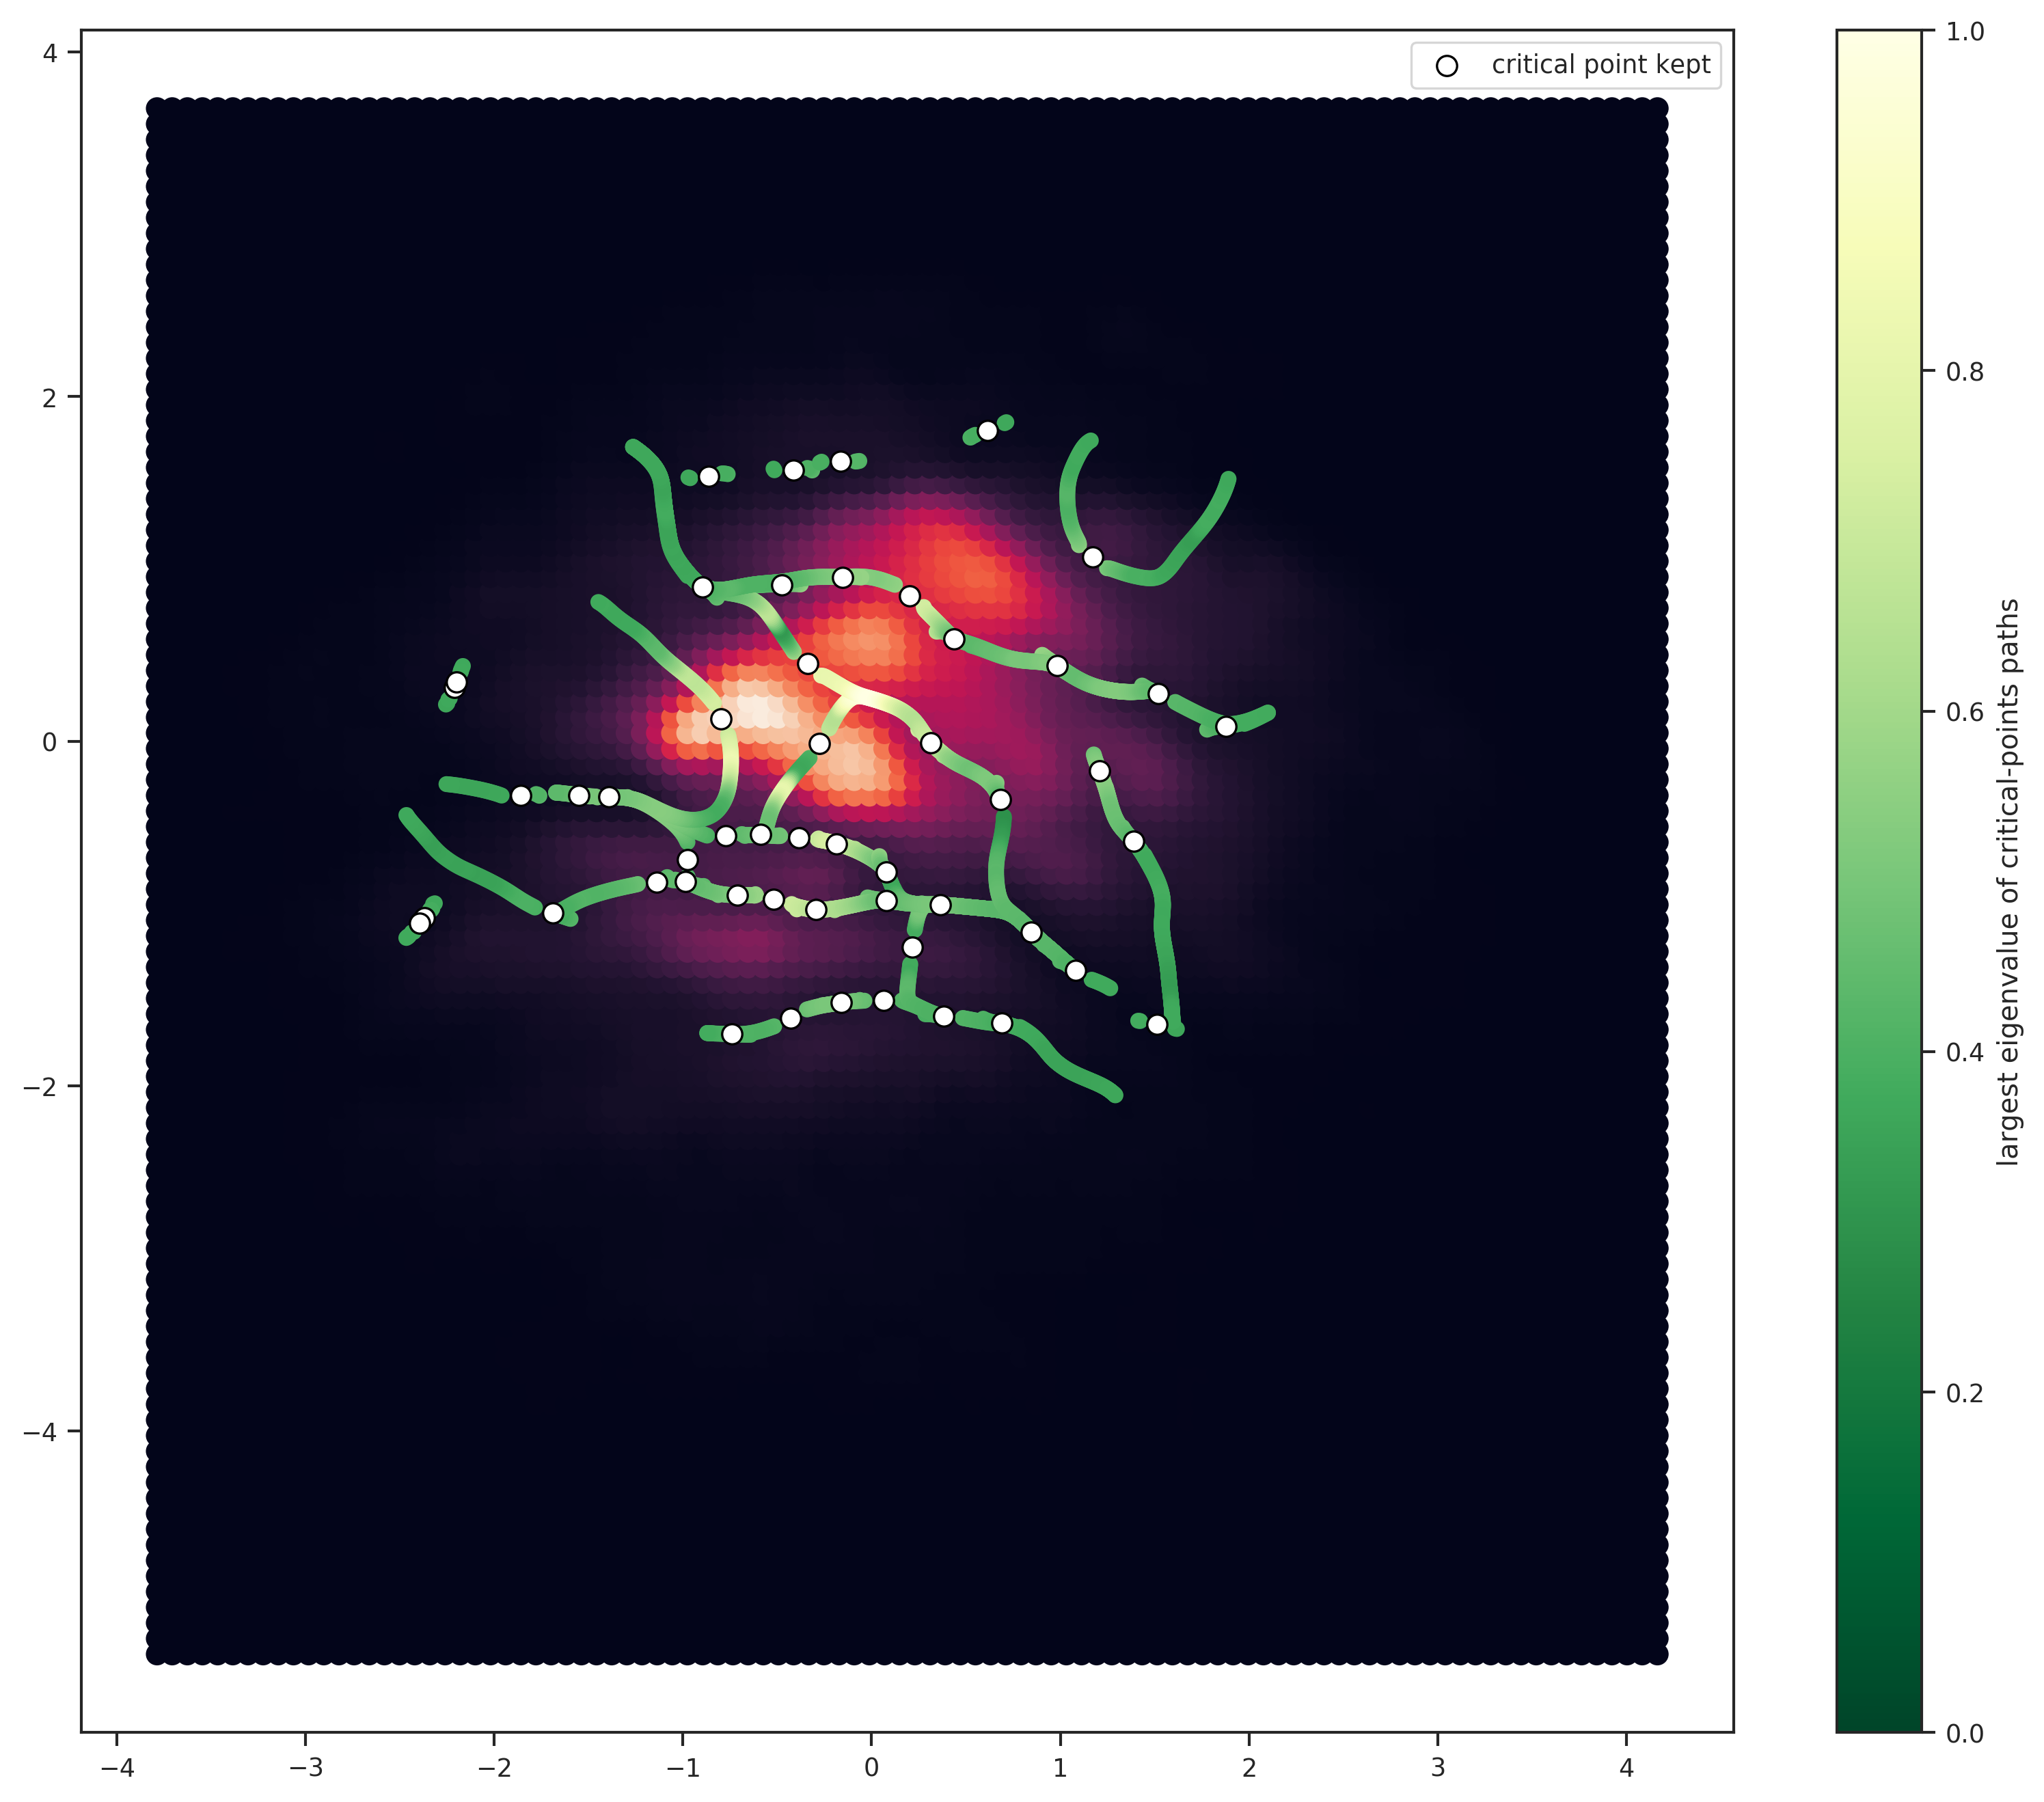
The above plot shows the galactocentric radial vs azimuthal velocities for ~90,000 nearby stars from Gaia data, courtesy of Jason Hunt (thanks!). The white dots circled in black as the “best” critical points selected based on the first (largest) eigenvalue of the Hessian. Their respective paths are colored in shades of green (based on the value of largest eigenvalue as well). This criterion should account for the “steepness” of a gap (I think?). But we could do the selection on all the points (critical+paths, not all shown here). And we could also do it based on other criteria!
Other ideas on the to-do list are: looking at the stability of gaps with regard to the bandwidth, bootstrapping or resampling. And I guess we also need to check if we can get the pip name gappy. (Because gapy is already taken, unfortunately!)