This week’s meeting started with an update from Rodrigo Luger about his work to map the surfaces of stars using phase curves and occulations. In particular, he has been working on techniques for increasing the efficiency of his methodology when the nullspace of the problem is large or, in other words, when very little information is actually available in the light curve. He has discovered a technique that is similar to previous work by Emily Rauscher where it is possible to re-cast the inference problem into the (much lower dimensional) subspace where the data are constraining, thus drastically reducing the computational cost. However, it seems like this improvement no longer applies if we want to actually generate the distribution over surface maps that are consistent with the data. It was suggested that it might be possible to generate these maps as a post-processing step, after fitting for all the other parameters of the system.
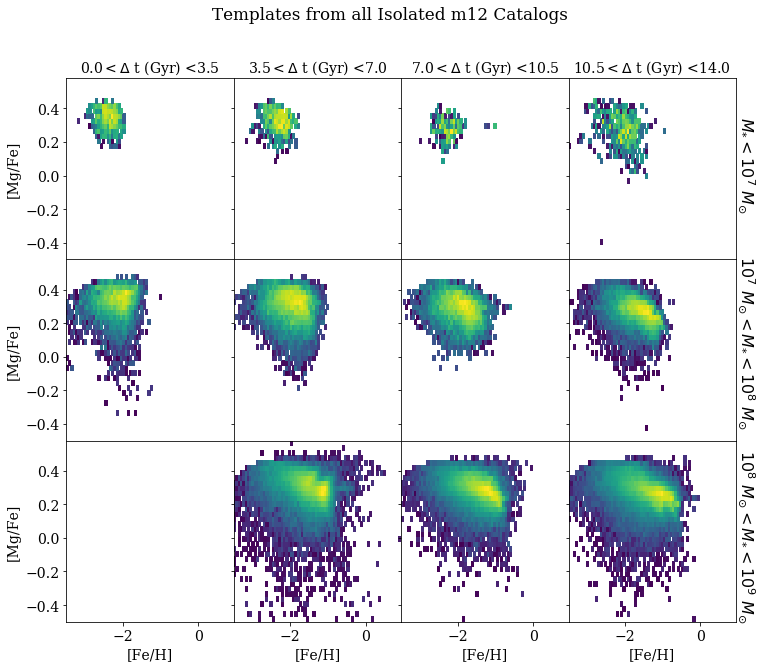
Next, Emily Cunningham updated the group on her project to disentangle the accretion history of the Milky Way stellar halo by modeling the abundance distribution of halo stars using templates built from observations of dwarf galaxies. She has preliminary results looking at a set of Milky Way-like simulations which provide an idealized test for the methodology. The header figure shows examples of some of the templates that she is using. However, since the model Emily is currently using just models the current abundance distribution as a linear combination of these templates, the interpretation of the results can be a little tricky. In particular, she is interested in determining the number and distribution (in, say, stellar mass and age) of the accretion events that assembled the halo. There was some discussion about the possibility of applying some sort of non-parametric mixture-of-templates model to make this measurement.
Then Kate Storey-Fisher shared some results from her project to detect anomalous galaxies in survey images using deep learning. Kate previously blogged about this project so you can check that post out for more details. Since that post, Kate has been developing an auto-encoder, trained on the residuals between the data and the GAN predictions for each galaxy, that she can then use to determine how “anomalous” each galaxy really is. In this context, the auto-encoder is acting as a dimensionality reduction that identifies features that seem to do a good job of ordering the the galaxy images in terms of how typical they are. There was some discussion about the possibility of skipping the GAN step in the process and directly applying the auto-encoder to the observations, but it’s possible that this wouldn’t perform as well since the GAN does a good job of building a distribution over the population of expected galaxy images.
Next, Trevor David shared three versions of a plot that he is making for a paper. He has taken high-resolution, time series spectroscopy of a transiting exoplanet (or, more specifically, its host star) and identified some excess variability in the red wing of the H-alpha line, in the out-of-transit data. This variance is close to a narrow telluric feature and the significance is low, but high enough to be interesting, so it is a bit tricky to demonstrate exactly what is being observed. The group had many opinions about the choices made in these plots and gave suggestions for improving the clarity.
Finally, we finished the meeting with a discussion, led by John Forbes, about the merits and costs of packaging and documenting code from a research project that is niche but potentially useful to other researchers. The argument was made that the most impactful scientific software will probably be simple (very good at exactly one thing) or extremely flexible (with all the possible knobs). Author’s note: I would argue, that perhaps there’s one other mode: a good “plugin” interface so that users can implement the knobs they need. But perhaps that falls into the second catagory anyways… In contrast, there was also a discussion of the fact that sometimes its not possible to predict all the potential use cases of your code and there are some examples where research code has been successful repurposed for related, unexpected applications. We did not come to any real conclusion about whether or not packaging and documenting all research code is worth it (I think it is!), but it was some good food for thought.