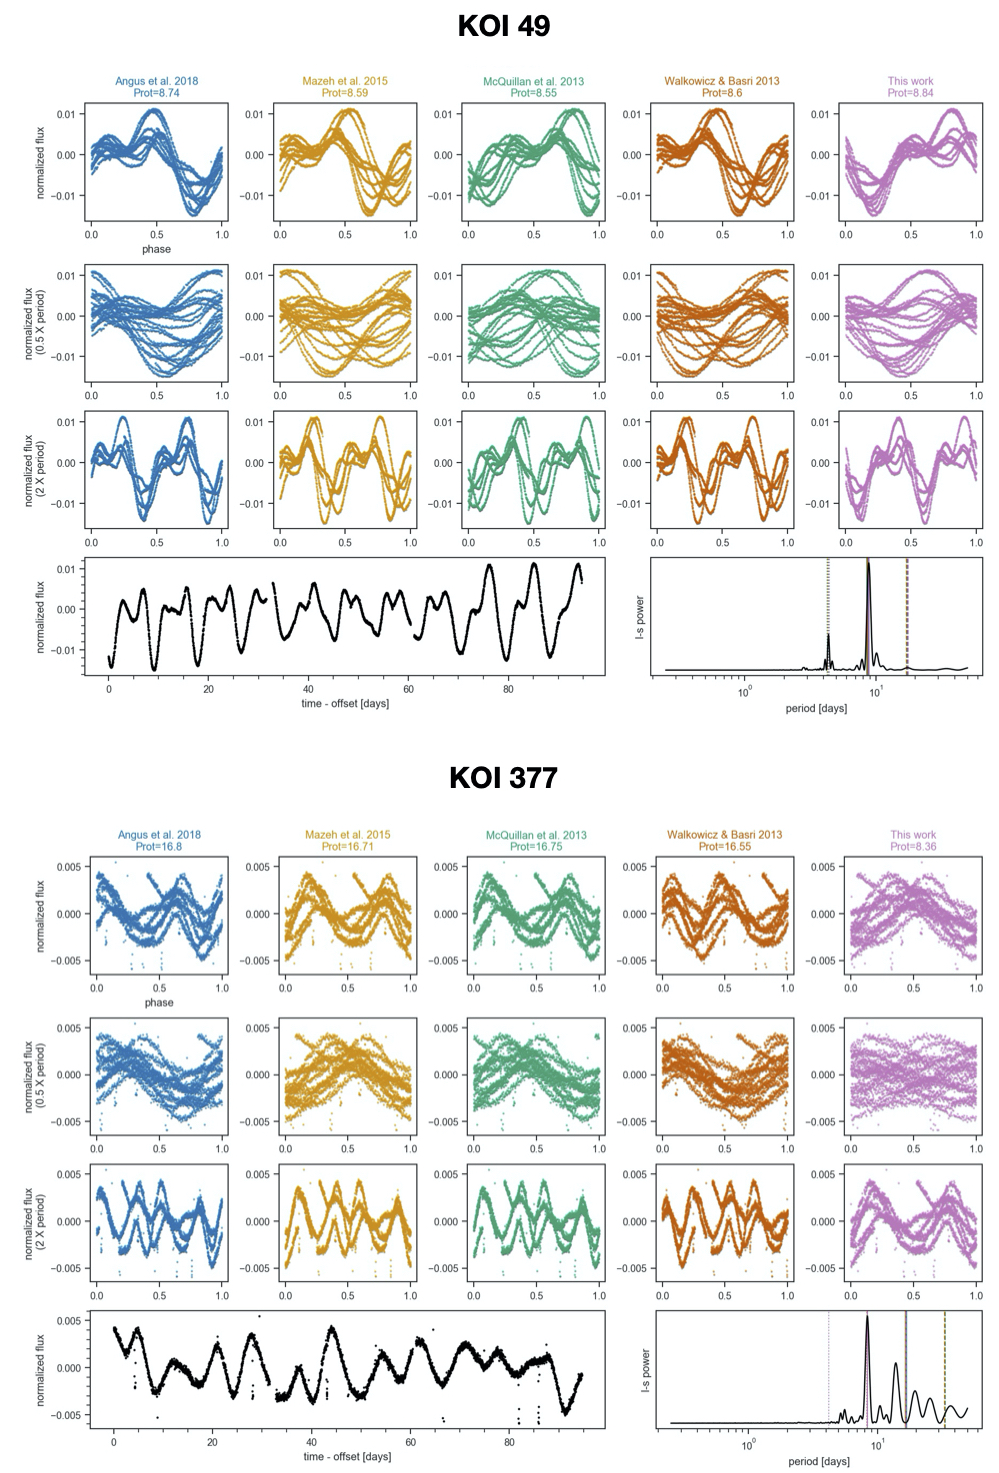
A common problem with algorithmic determination of rotation periods from light curves is that the “best” period may actually be the undertone/subharmonic or harmonic of the true period (in other words, twice or half the true period). Two real examples from the Kepler mission are shown here.
In the first row of each figure, the Kepler light curve of a star is phase-folded on a period either from the literature or determined using a Lomb-Scargle (L-S) periodogram. In the second and third rows, the light curve has been phase-folded on half and twice the period in the first row, respectively. The bottom two panels show the light curve from a single Kepler quarter and the periodogram itself.
With KOI 49, the various estimates for the rotation period are in agreement, and it seems clear that those estimates are correct. Why? We see two peaks (and troughs) in the phased light curve of uneven height. The simplest explanation for this behavior is a fairly stable arrangement of two dominant spot groupings of different size and/or contrast on the surface. Reality is definitely more complicated, but the light curves of many stars can be approximated with a two-spot model.
For KOI 377, the literature period estimates (first four columns) are in agreement, while the L-S method (last column) prefers approximately half of that period. It’s worth noting here that the L-S method assumes a sinusoidal model for the data and has indeed selected the period which best approximates the data as a sinusoid. What’s going on?
Imagine this pathological case: a star with two spots equal in size, contrast, and latitude but separated by 180 degrees in longitude, spinning on an axis perpendicular to our line-of-sight. As this star rotates, an observer would record a light curve showing two peaks and two troughs of exactly equal height/duration, and would not be blamed for reporting the rotation period as half the true period.
What is the correct period for KOI 377? From the plot it’s not immediately clear. However, other clues exist in the light curve. Compared with KOI 49, the light curve is less “stable” and shows variations about twice as small in amplitude. From ensemble studies of Kepler light curves it’s known that rotation period is anti-correlated with variability amplitude, and differential rotation (which traces “stability”) correlates with stellar mass, which itself correlates with rotation period. So, one path towards determining more reliable rotation periods may rely on all available information, such as the variability amplitude and stellar parameters. In fact, group members Lucy Lu and Ruth Angus are working on just this problem with Astraea.