I’m generally interested in the problem of mapping the surfaces of stars and exoplanets, and while I’ve focused so far on doing this using photometric timeseries, for the past couple months I’ve been tinkering with spectroscopic data and the idea of Doppler imaging. The basic idea here is to take high resolution spectra of a rapidly rotating star at different rotational phases and look at the distortion of its spectral lines as starspots rotate from the blueshifted hemisphere to the redshifted hemisphere. One of the seminal papers on this method is Vogt et al. 1987, who did an experiment where they ``painted’’ the letters VOGT on the surface of a star, generated a bunch of synthetic spectra, and attempted to recover the stellar surface map from that dataset. The authors devised a method that successfully recovered the VOGT pattern, and this has since been adapted and applied to dozens of real systems, often quite successfully.
However, the techniques employed in Doppler imaging are often computationally expensive, as they require running radiative transfer models in thousands of discrete cells on the surface of the star, then numerically integrating the specific intensity to arrive at a model for the observed spectrum. Most studies therefore focus primarily on optimization: given a fiducial set of stellar parameters (such as inclination, angular velocity, differential rotation parameter, etc.), the goal is to find the single surface map that best matches the observed spectrum, usually via a non-linear optimizer and using priors that make convergence fast. While this works well, it can mask the great degree of uncertainty inherent to the problem, hide the various degeneracies at play, and introduce biases due to the fact that parameter like the stellar inclination are rarely known precisely.
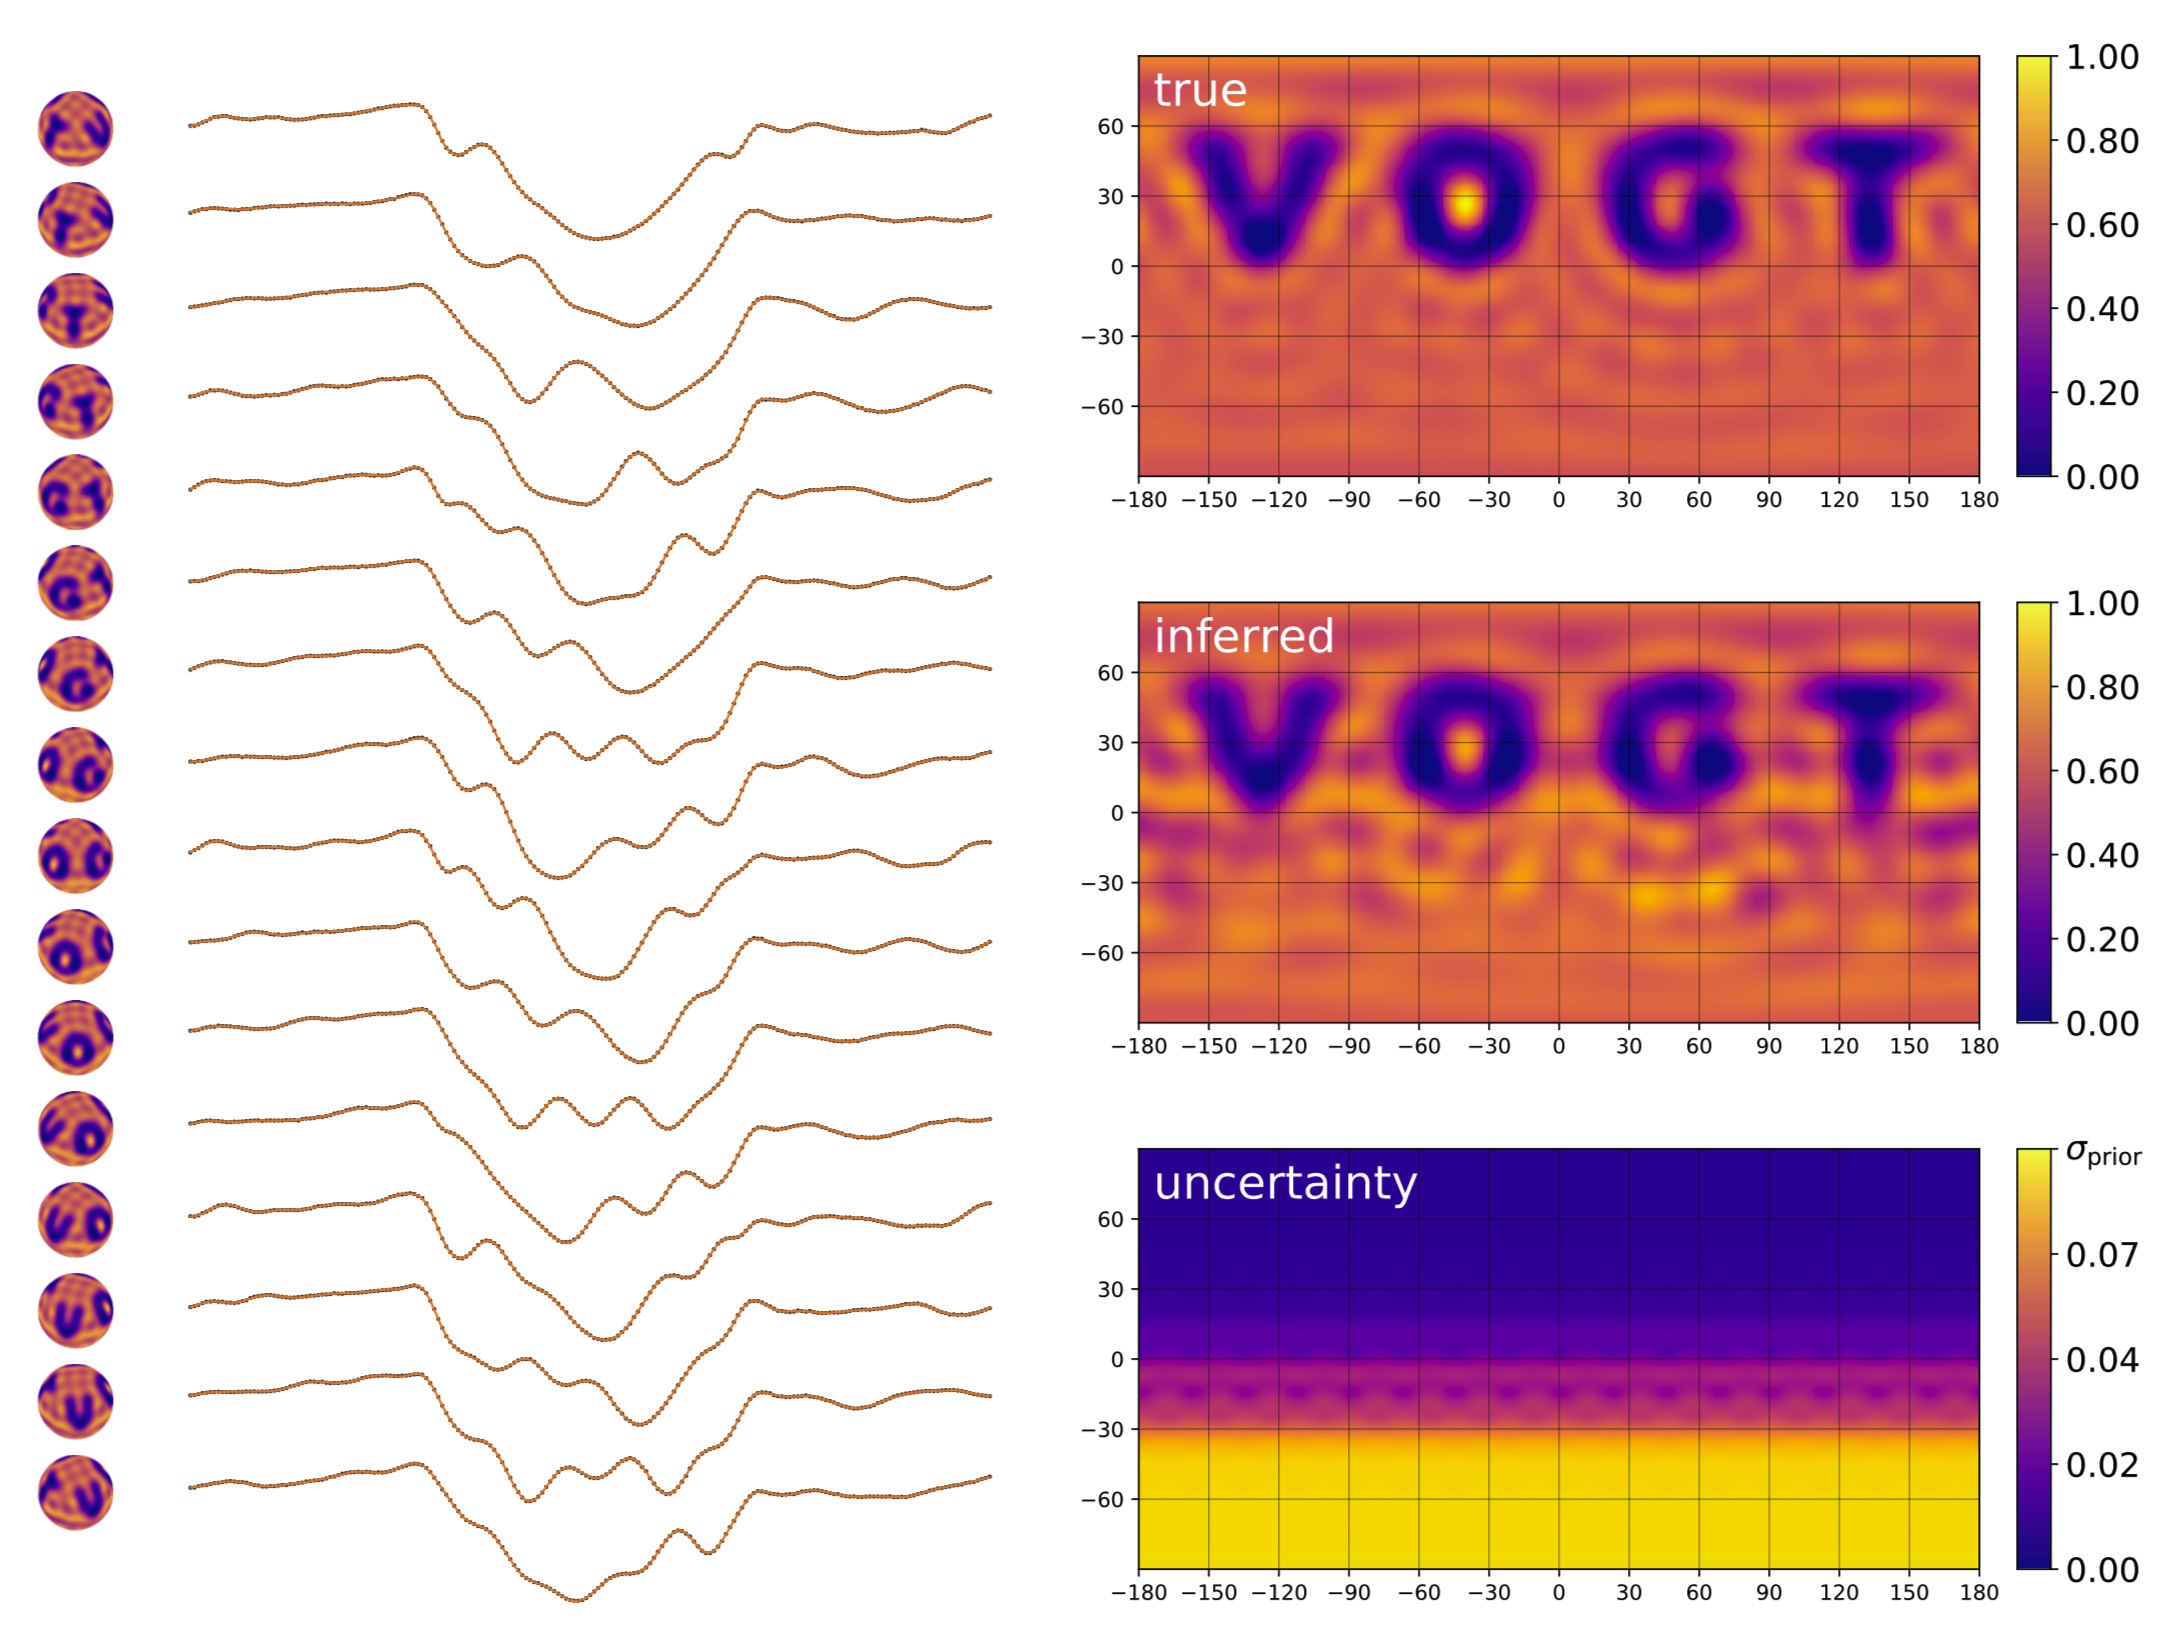
To improve on this, I’ve been working on extending my starry code (Luger et al. 2019 and github.com/rodluger/starry) to work with spectra by expanding the wavelength-dependent stellar surface map in spherical harmonics. I worked out some cool analytic results that allow me to not only compute a model for the spectrum analytically, but also to invert the problem and quickly solve for both the maximum likelihood surface map and its uncertainty. The figure above shows a test of my code on the classic VOGT star. The 16 epochs of data are shown on the left, next to the phases of the star seen by the observer. The input map is shown at the top right, with the inferred map below it, and the intensity uncertainty at the bottom.